

.webp)
Reducing food waste starts with one essential step: defining your food waste baseline.
A food waste baseline is the measurable starting point that records how much waste your kitchen generates before implementing reduction initiatives. It allows restaurants and production kitchens to track improvements over time using consistent, reliable data.
In the FIT ecosystem, data is the foundation of efficiency—and the baseline is the anchor that makes measurable progress possible. Without it, reduction claims are guesswork. With it, every gram saved becomes documented performance.
Why a Food Waste Baseline Matters
Whether you manage a restaurant kitchen or a large-scale production facility, a clear baseline allows you to:
Measure real food waste reduction
Track cost savings accurately
Improve operational efficiency
Align teams around measurable goals
A baseline transforms food waste management from observation into a data-driven strategy.
How to Define Food Waste Metrics in Restaurants and Production Kitchens
To ensure consistency across different operational environments, FIT prioritizes two core metrics.
1. Restaurant Kitchens: Food Waste per Cover (grams)
For restaurants, the most accurate performance indicator is: Food Waste per Cover = Total Food Waste (g) ÷ Total Covers Served
This metric accounts for fluctuations in guest volume. A busy Saturday and a quiet Tuesday become comparable because waste is measured relative to customer count.
2. Production Kitchens: Average Total Food Waste per Day (kg)
For centralized production kitchens, catering facilities, or commissaries, the key metric is: Average Daily Food Waste = Total Food Waste (kg) ÷ Number of Operational Days
This reflects overall production efficiency rather than customer volume.
By anchoring performance to these specific benchmarks, you eliminate anecdotal assessments and move toward measurable, standardized results.
How to Calculate a Food Waste Baseline Accurately
Consistency depends on complete and synchronized data. To calculate a precise food waste baseline:
- Record total food waste across all shifts.
- Record total covers (or operational days).
- Divide waste by service volume.
- Ensure both data sets align for the same periods.
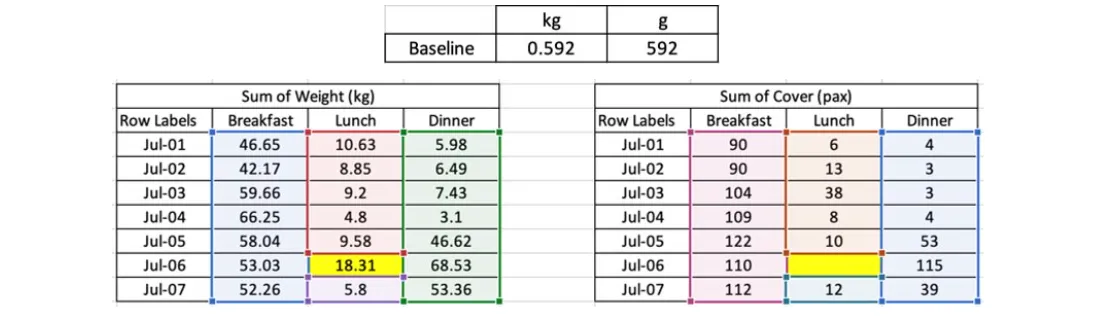
- The Critical Rule: Data Integrity
- Food waste tracking software must protect against incomplete entries.
Example scenario: You have waste data for Breakfast, Lunch, and Dinner across a full week—but Lunch covers on July 6th are missing.
If that shift is included, the baseline becomes artificially inflated.
How FIT Maintains Accuracy
To prevent distorted calculations:
The system excludes shifts where either waste data or cover data is missing. Only complete shift pairs are included. The final calculation uses synchronized totals only. This approach ensures your food waste baseline reflects operational reality—not human error.
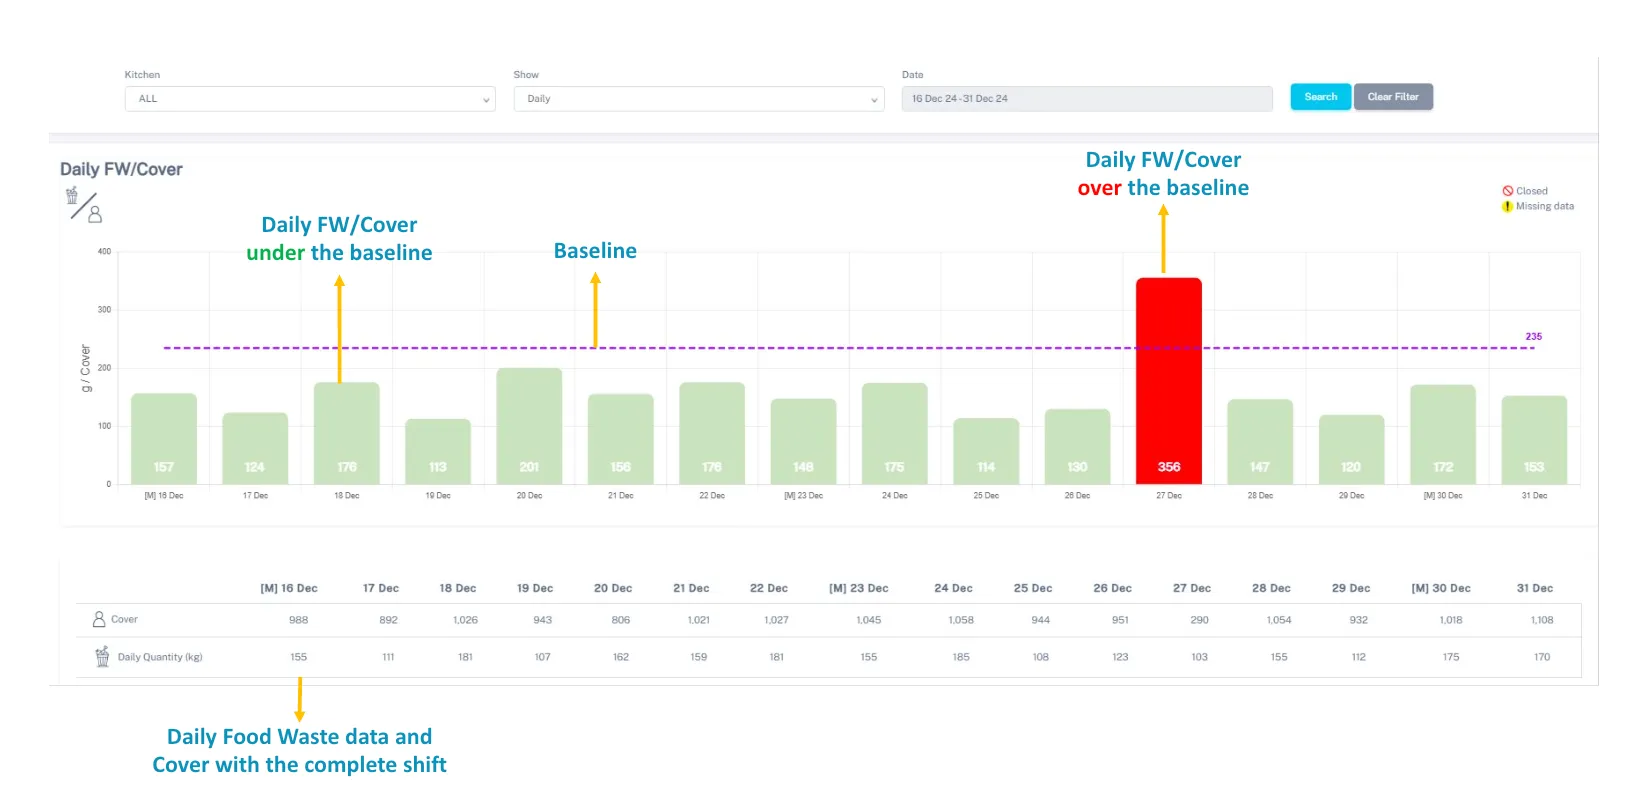
How to Monitor Food Waste Reduction Using Analytics Dashboards
Once your baseline is established, continuous monitoring becomes critical. FIT’s dashboard and weekly reports translate raw data into immediate performance signals.
1. Reduction Percentage Snapshot
Your overall progress is displayed as a percentage compared to your baseline.
Green % → Waste is decreasing
Red % → Waste is increasing
This allows instant executive-level clarity.
2. Performance Bar Graphs
Detailed analytics display food waste per cover or per day with color-coded indicators:
Green Bar → Performance within or below baseline
Red Bar → Waste increase during that period
This visual structure allows kitchen managers to identify patterns quickly—by shift, day, or operational cycle.
What to Do When Food Waste Increases
A red signal is not a failure—it is a prompt for structured review.
Follow this two-step audit process:
Step 1: Check for Data Gaps
- Verify cover counts
- Confirm waste entries
- Review shift completeness
Often, apparent spikes are caused by incomplete data.
Step 2: Review Operational Factors
If the data is accurate, investigate:
- Overproduction
- Menu changes
- Special events
- Supplier variations
- Staff rotation
By distinguishing data errors from operational realities, kitchens maintain both accuracy and accountability.
Best Practices for Maintaining Food Waste Data Consistency
To protect your food waste baseline over time:
Standardize weighing procedures
Train staff on accurate input
Use automated tracking tools
Conduct weekly data reviews
Compare results against historical baselines
Food waste tracking software is most powerful when paired with disciplined operational habits.
Ready to define your starting line?
Stop guessing and start measuring. Discover how FIT Tech turns your kitchen data into a clear roadmap for reduction. Read the Hotel Food Waste Financial White Paper
.jpeg)
.jpg)
